Extension logs
Extensions play an important role in Rossum, allowing you to customise various workflows to better suit your needs. When there's a problem with an extension, it's crucial to find it quickly and see what's going wrong. That's where the logs come in. They give you detailed information to help fix the problem. By using extension logs, you can deal with issues efficiently and keep your work going smoothly. Having detailed extension logs also helps you avoid getting stuck, so you can fix problems fast and stay productive in Rossum.
Extension errors on validation screen
When an extension or add-on causes an error in Rossum, you will see a red message displayed above the "Confirm" button, letting you know something went wrong.
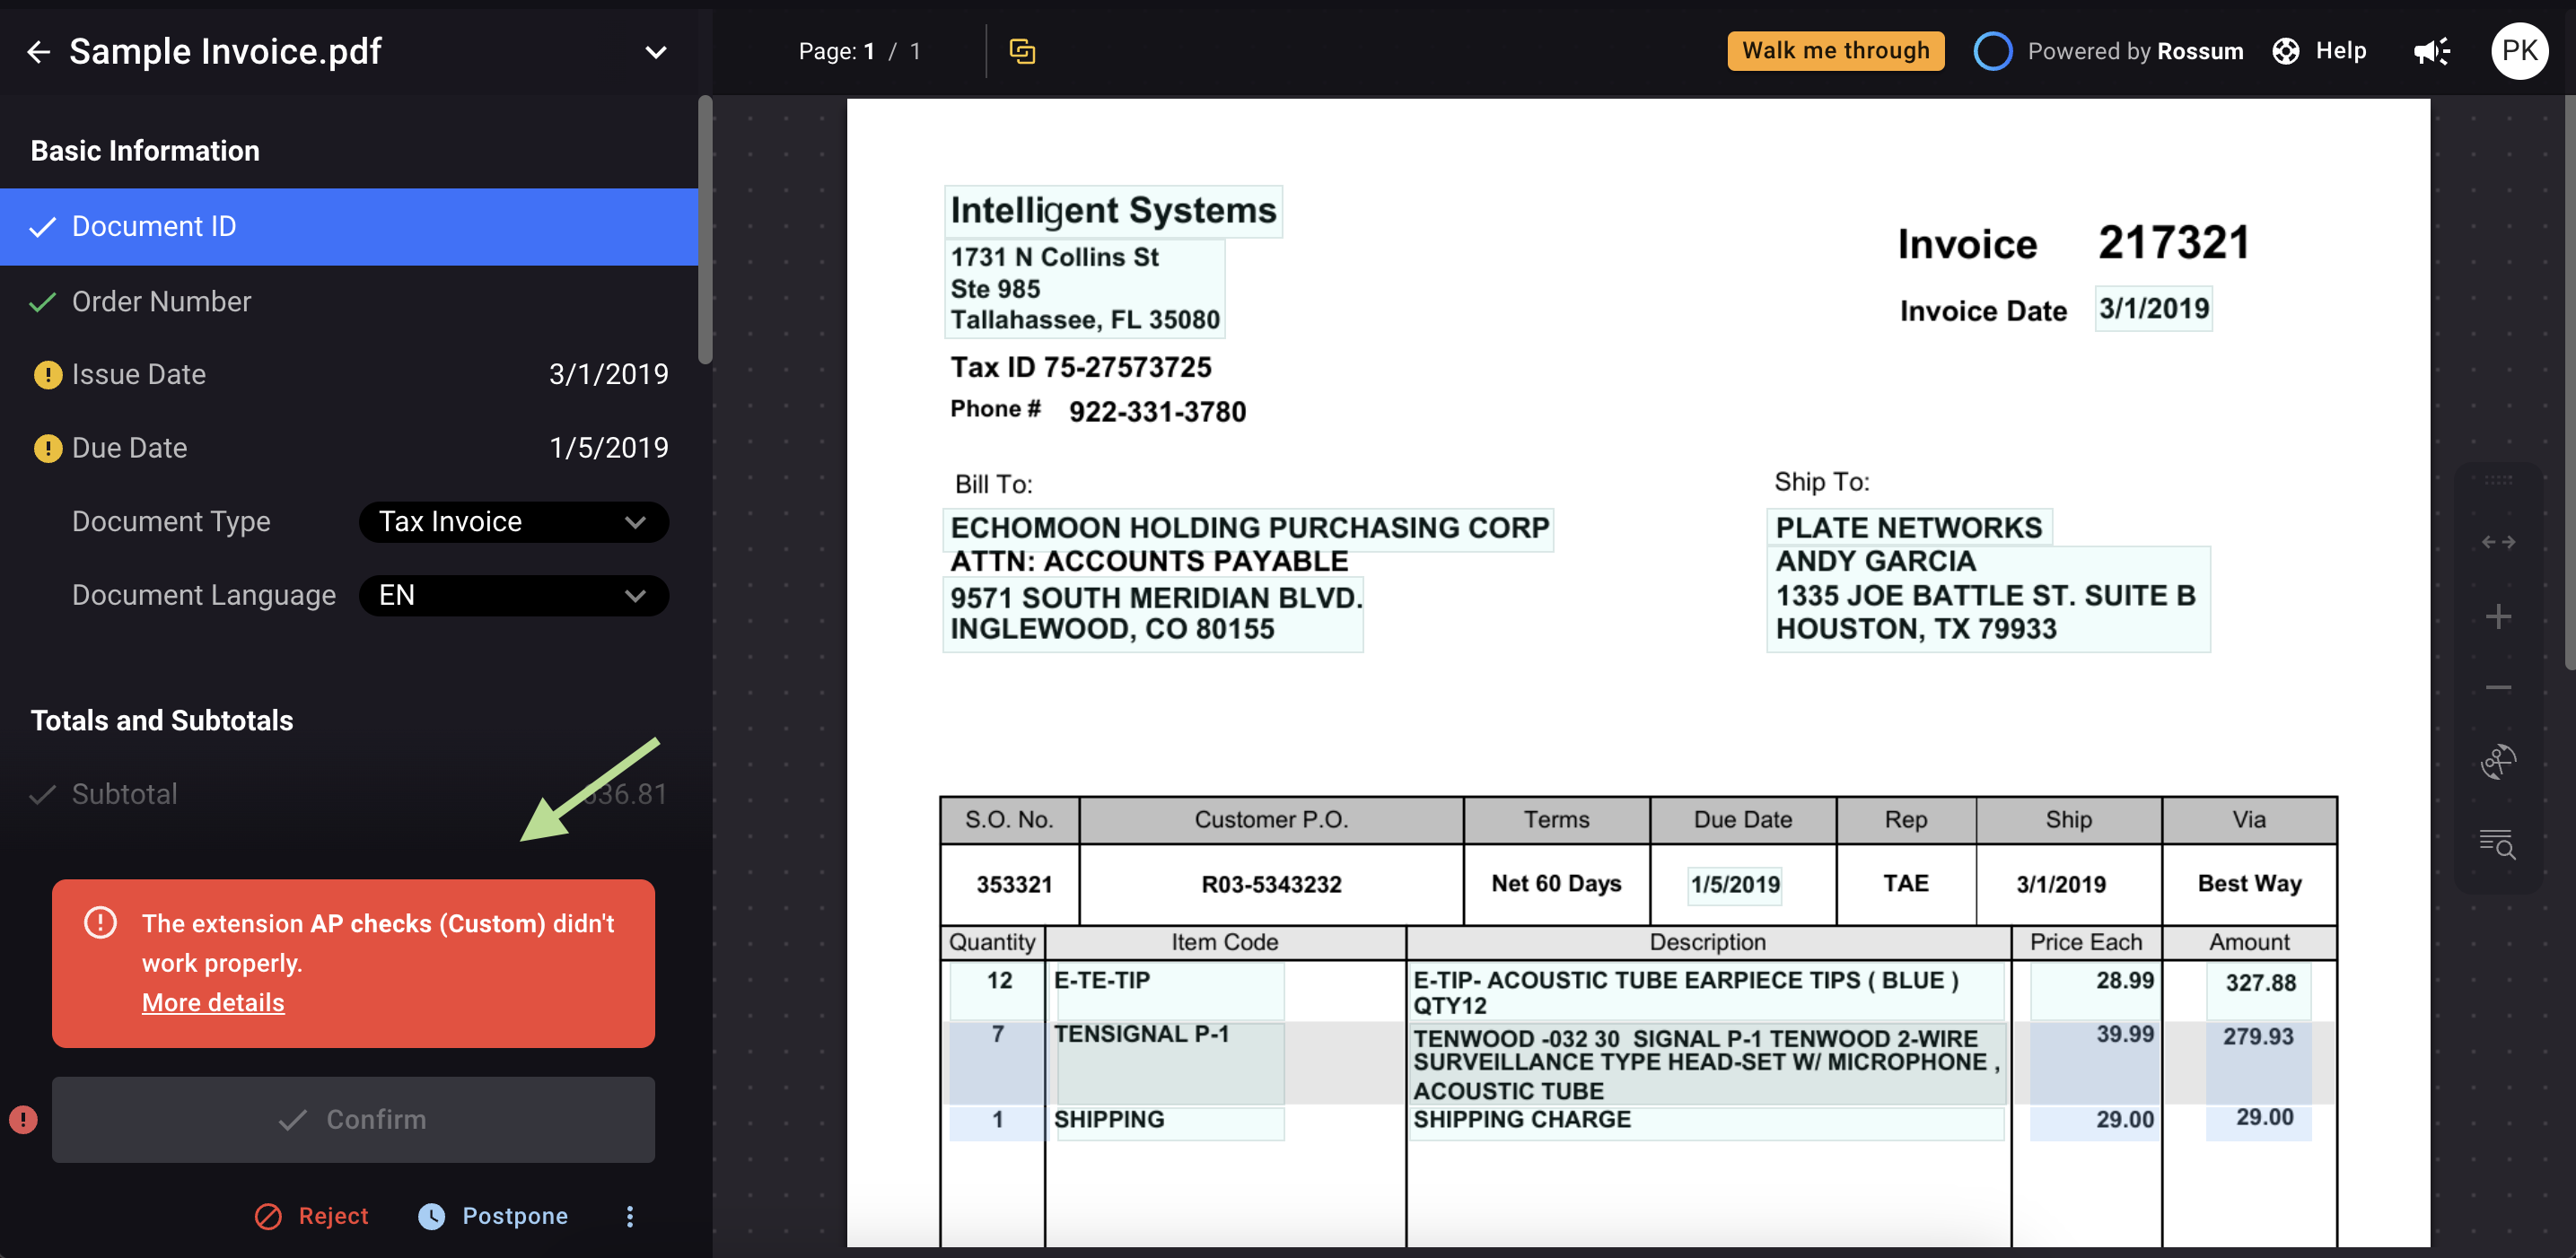
To investigate the problem further, you can click on "More details." This action will open a new window where you can find a description of the problem and a few additional options.
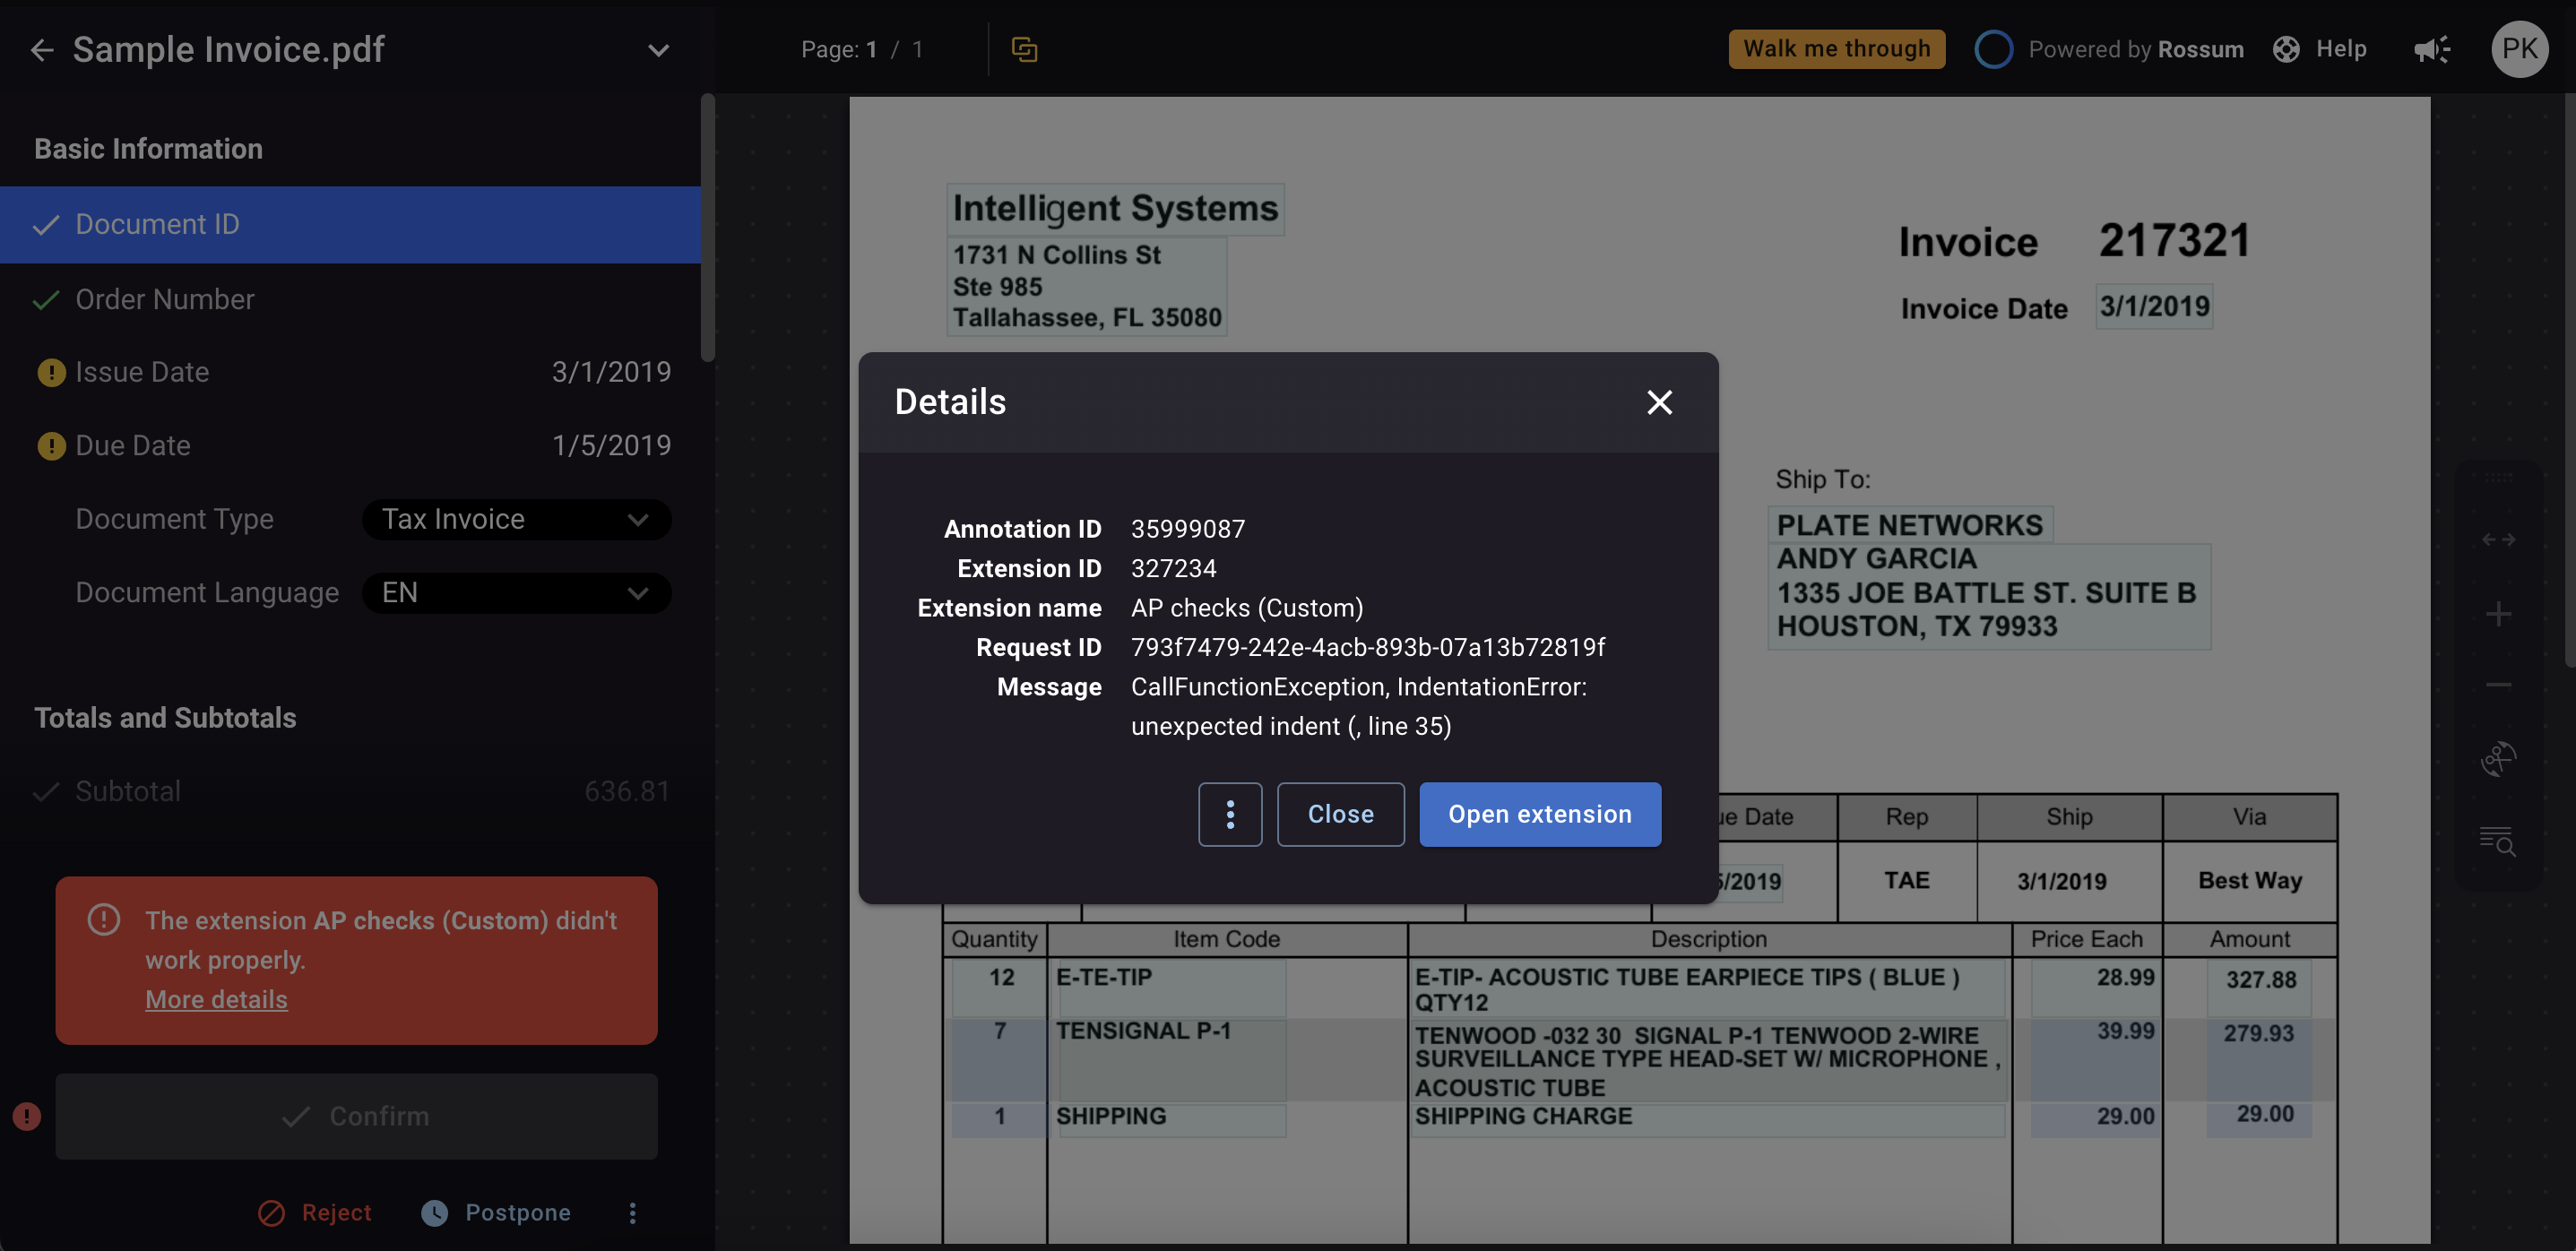
In this new window, you have the option to open the extension that caused the error. This can be helpful if you need to make any adjustments or modifications.
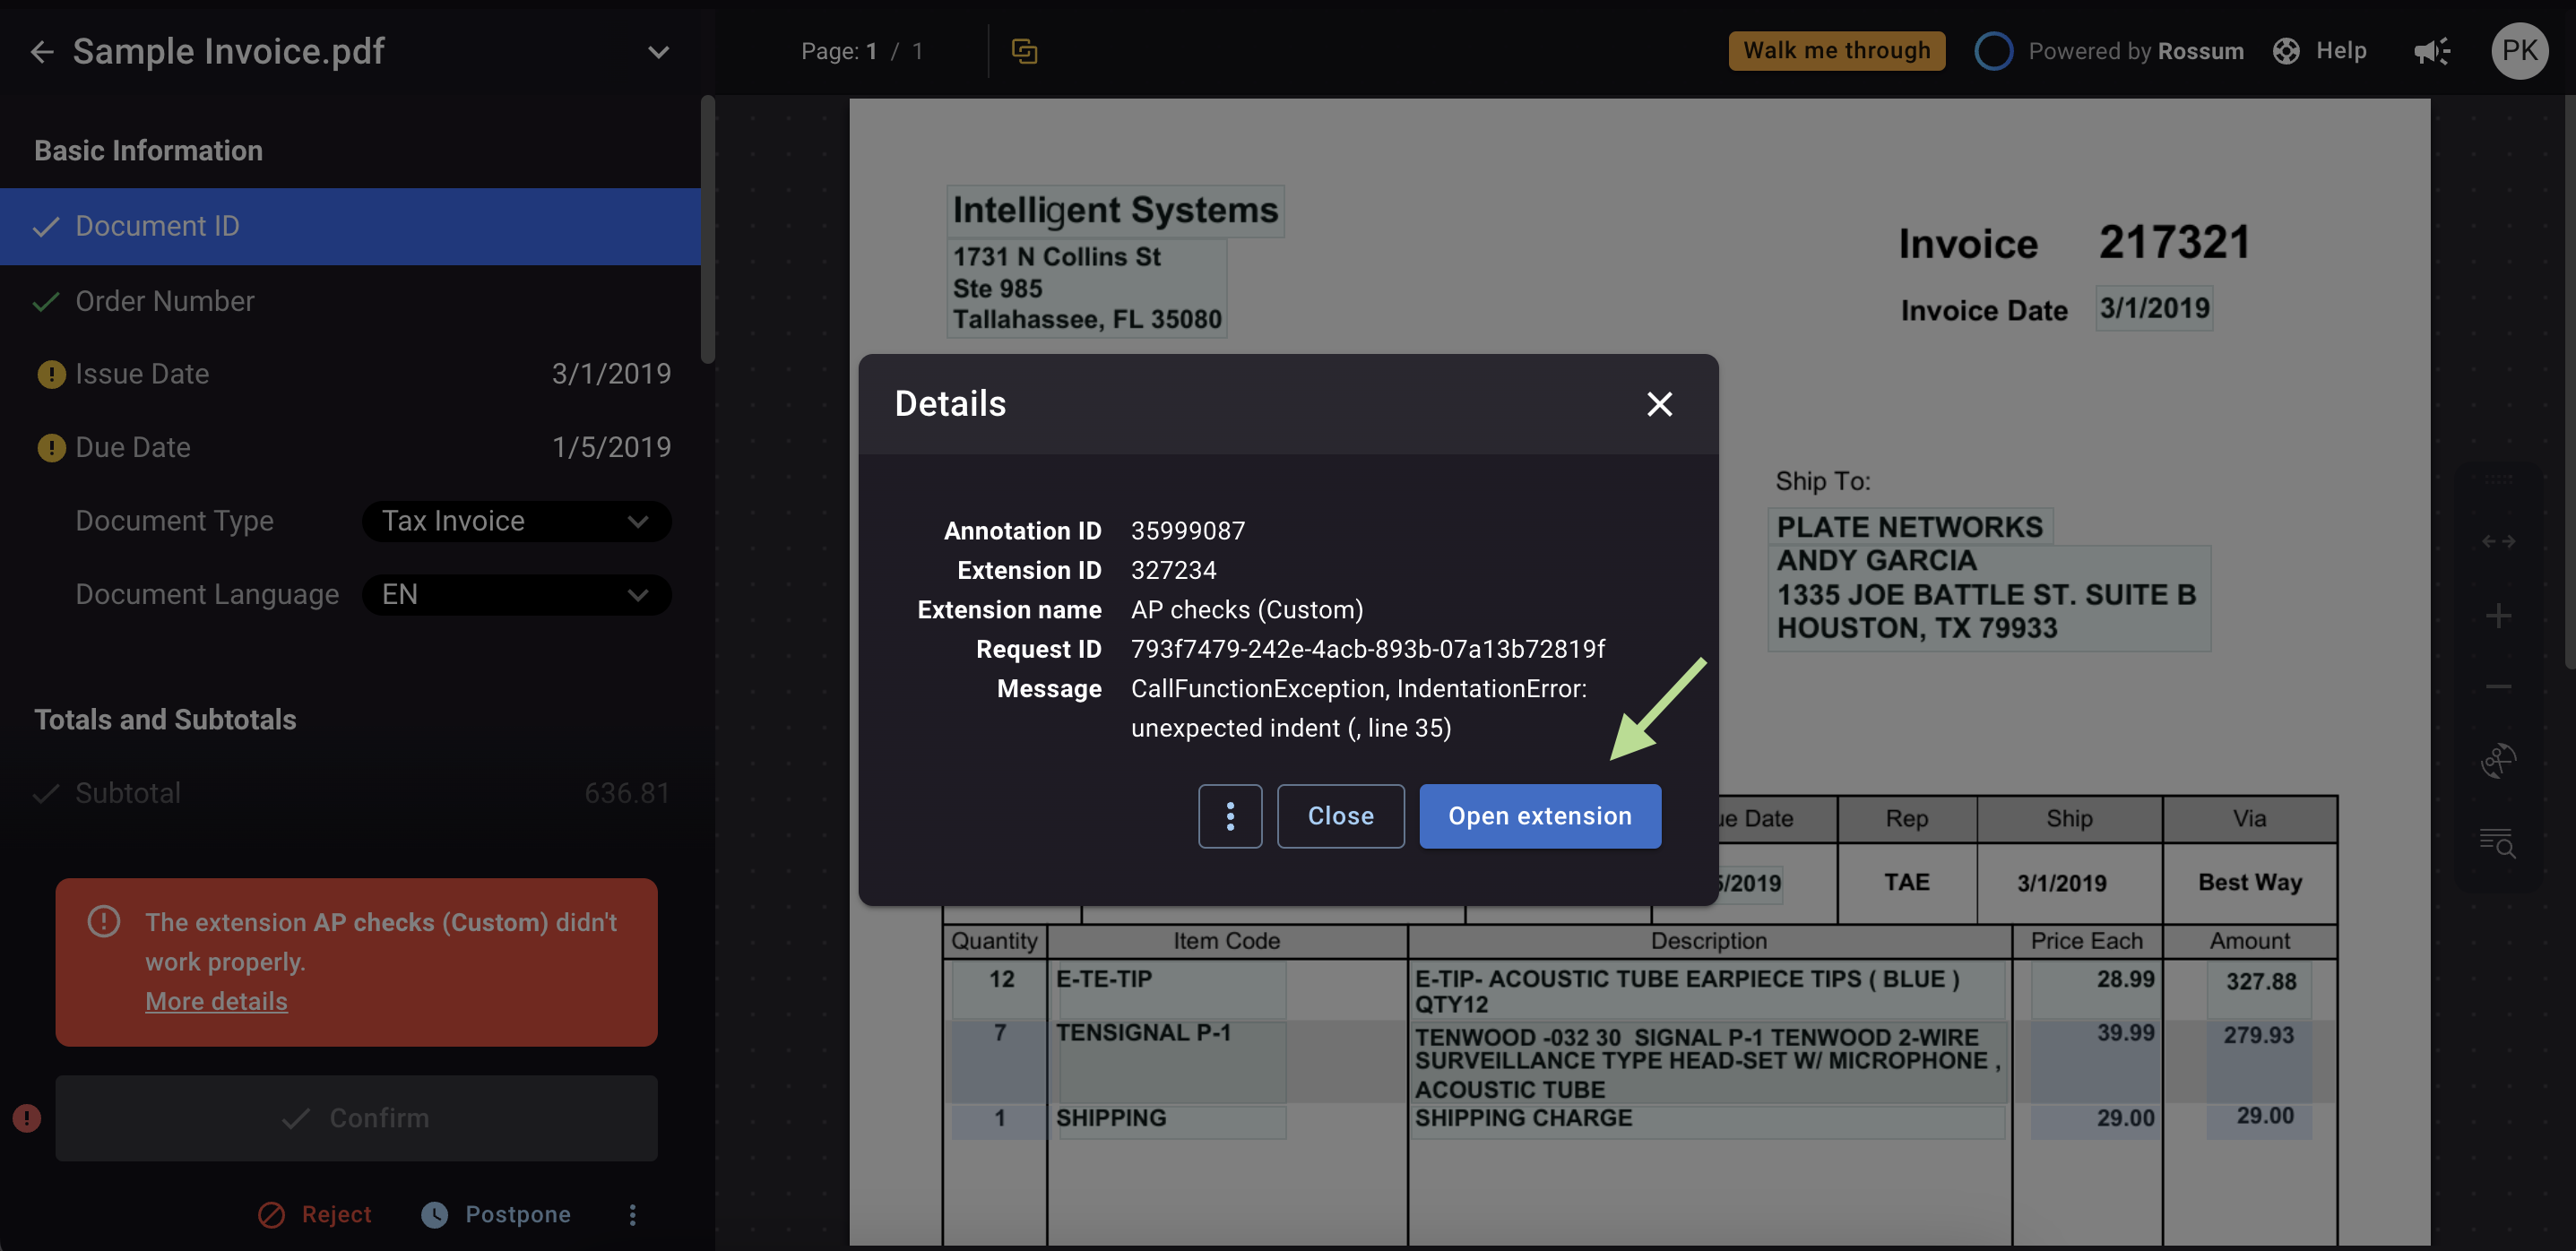
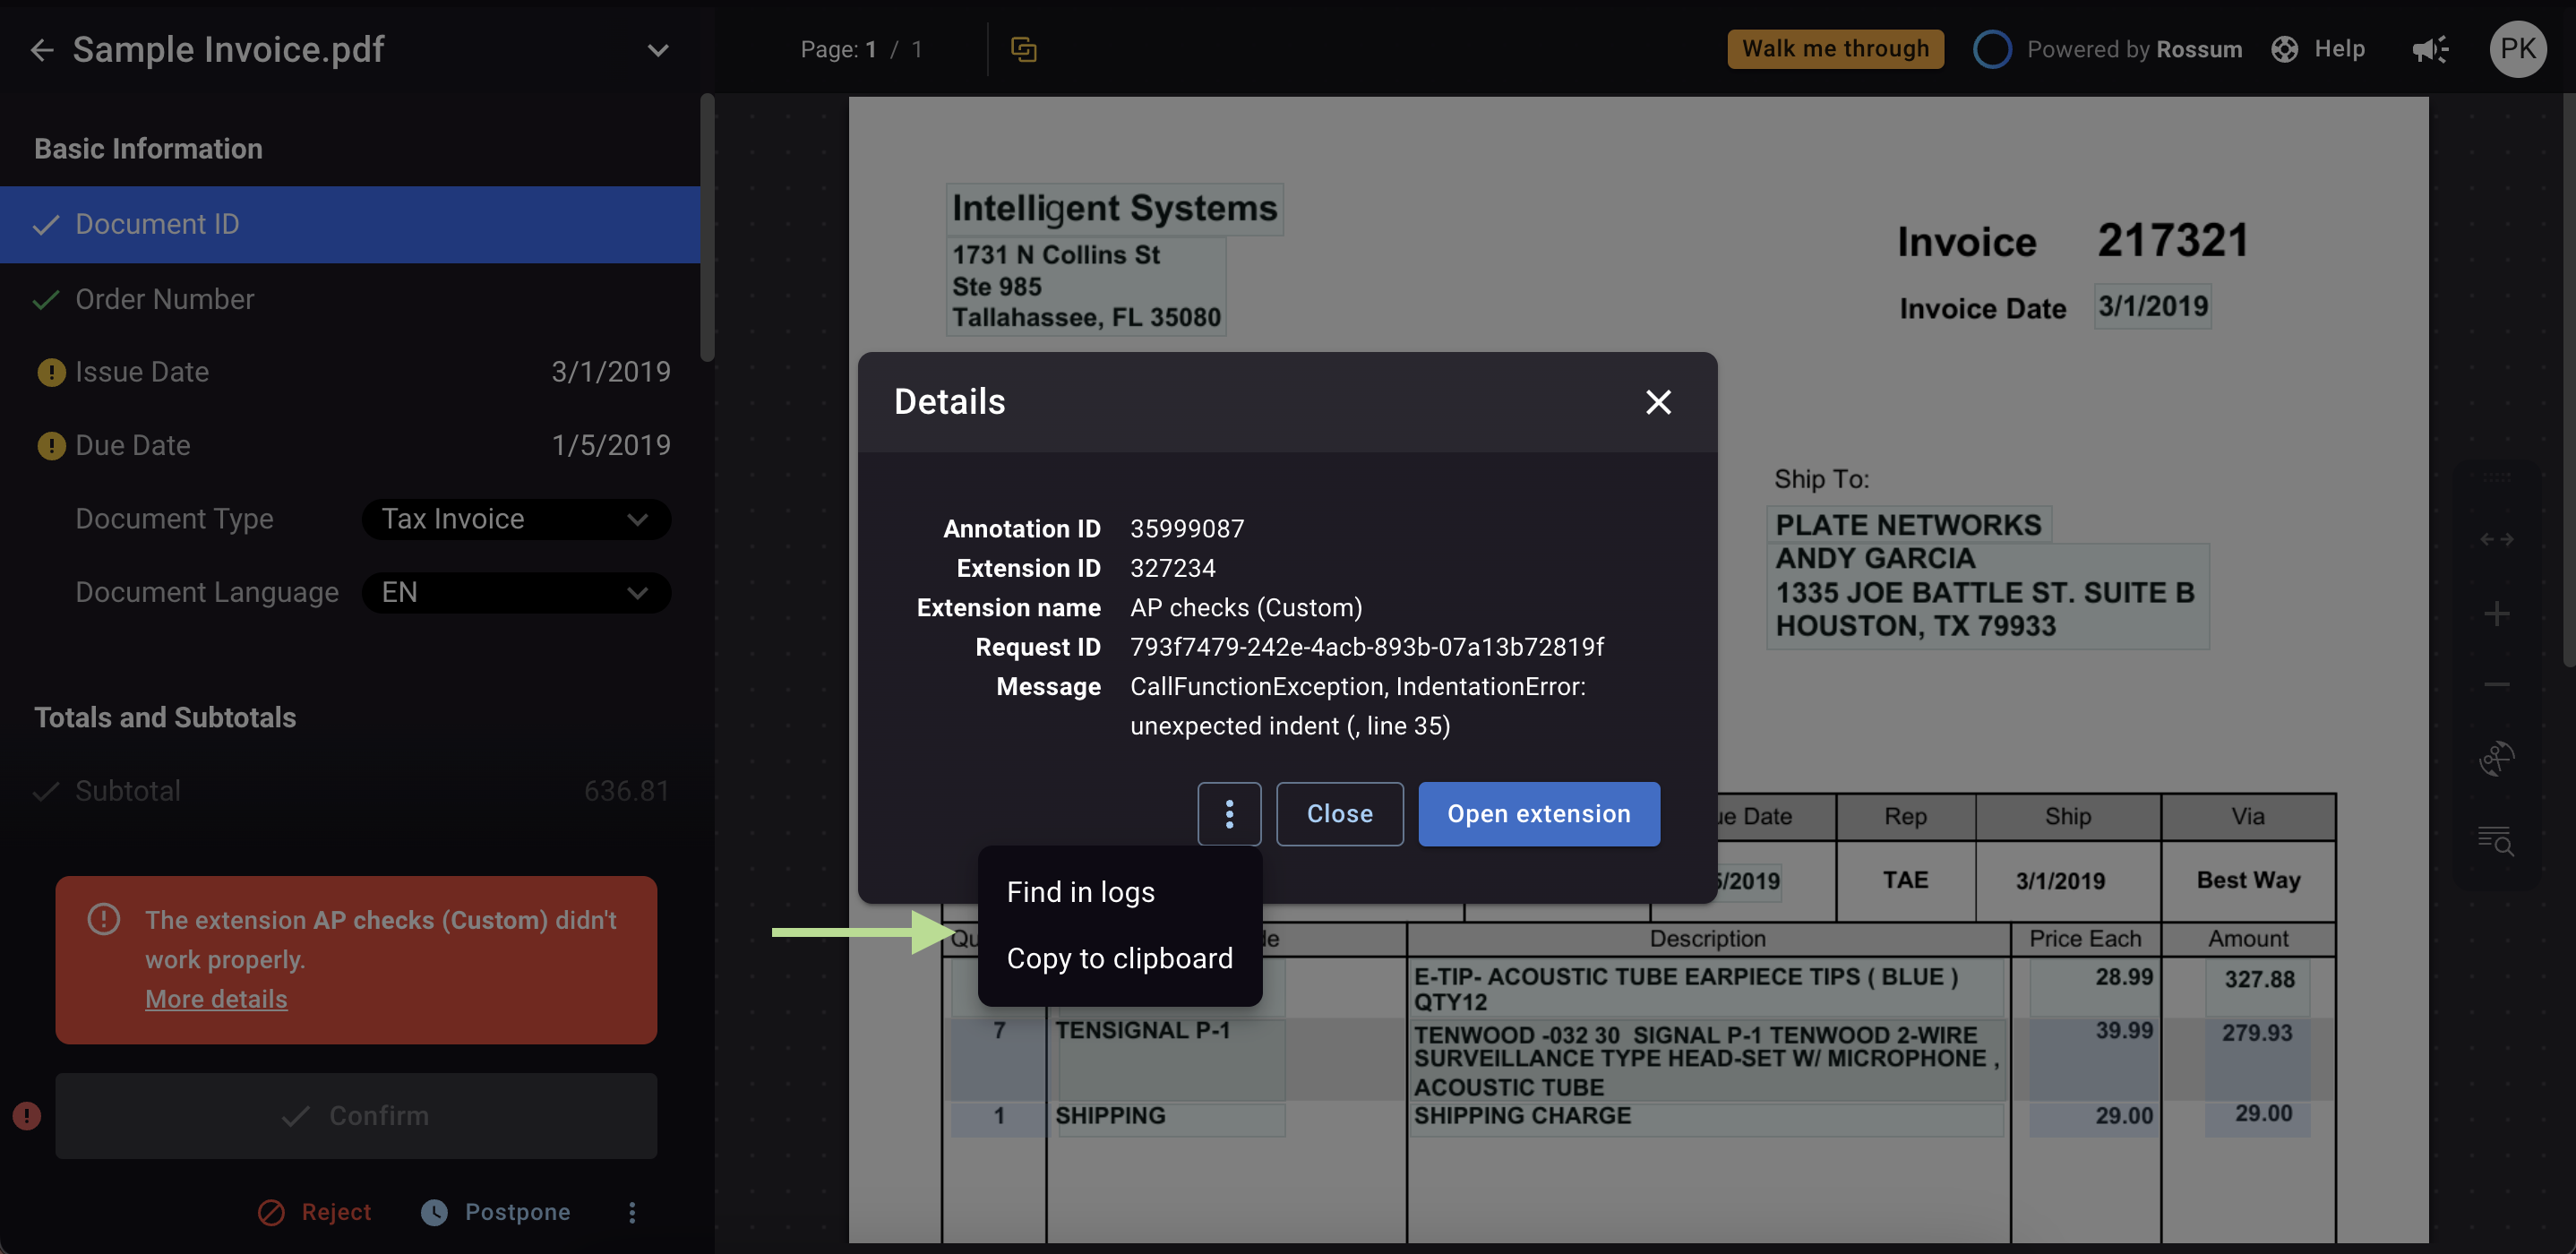
You also have the ability to copy the error details to your clipboard. This is useful if you want to share the information with Rossum support or the team responsible for maintaining the extension.
Additionally, you can jump directly to the logs to view more specific details about this particular error. This can help in troubleshooting and resolving the issue efficiently.
Please keep in mind that logs are accessible only to users with the admin role in Rossum. If an annotator encounters an error, they can view the details and copy them to share with the system administrator.
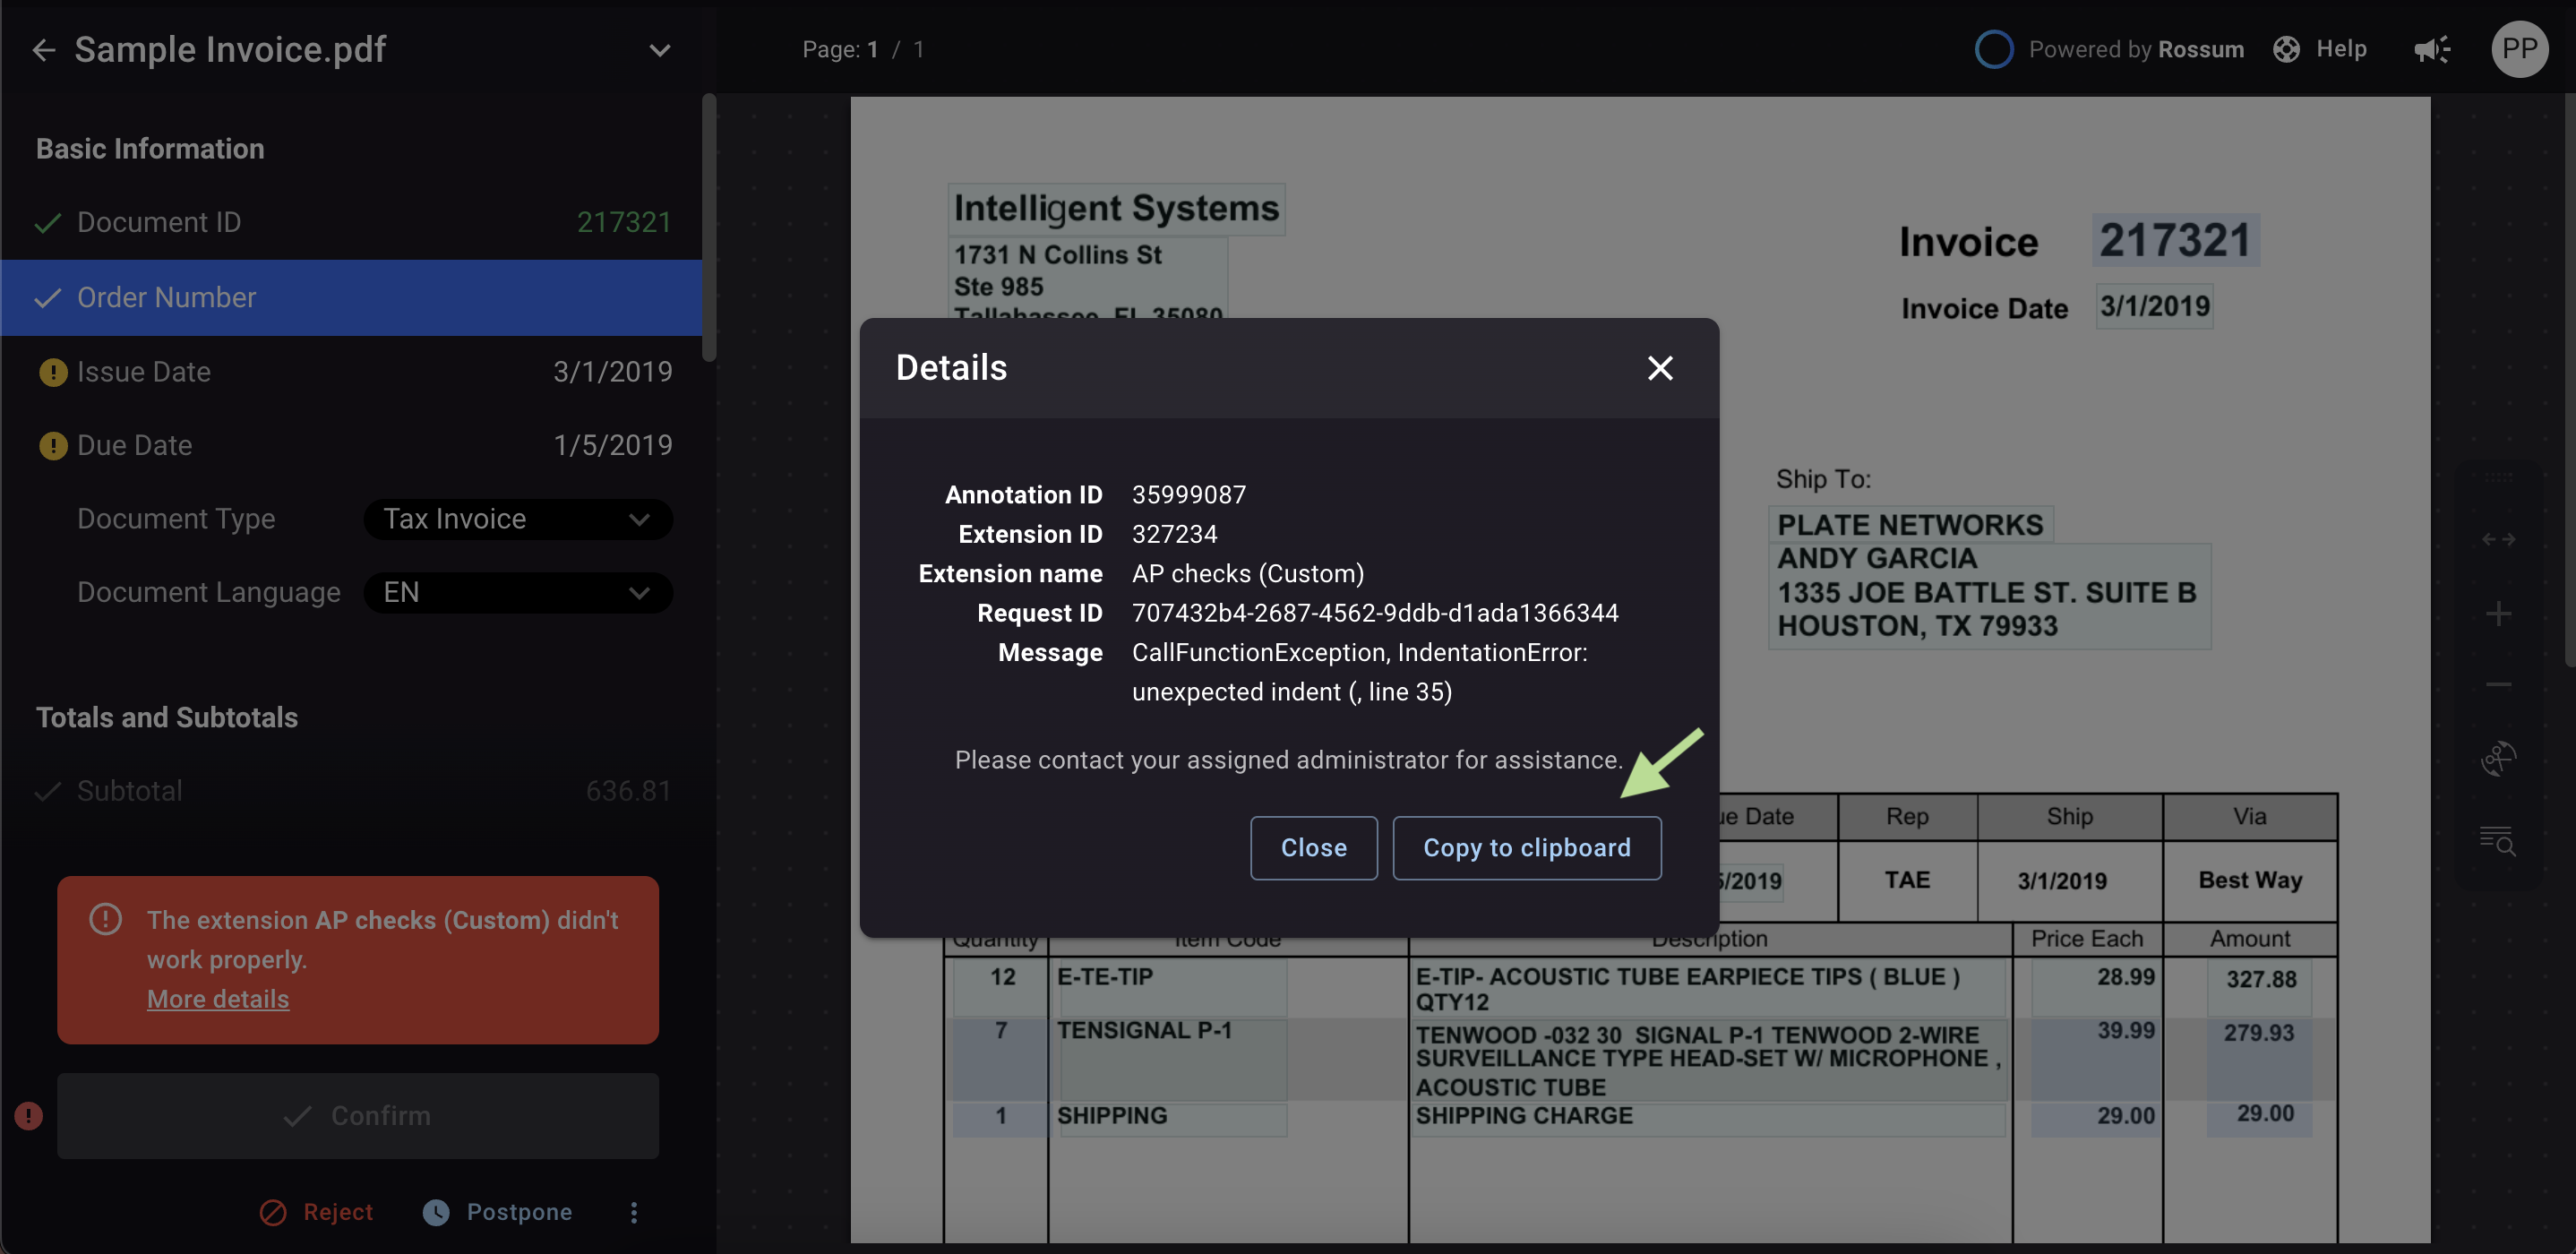
Extension logs
To display all logs please go to the "Add-ons" menu and click on the "Logs" tab. Here, you will find logs for all the extensions available on your account.
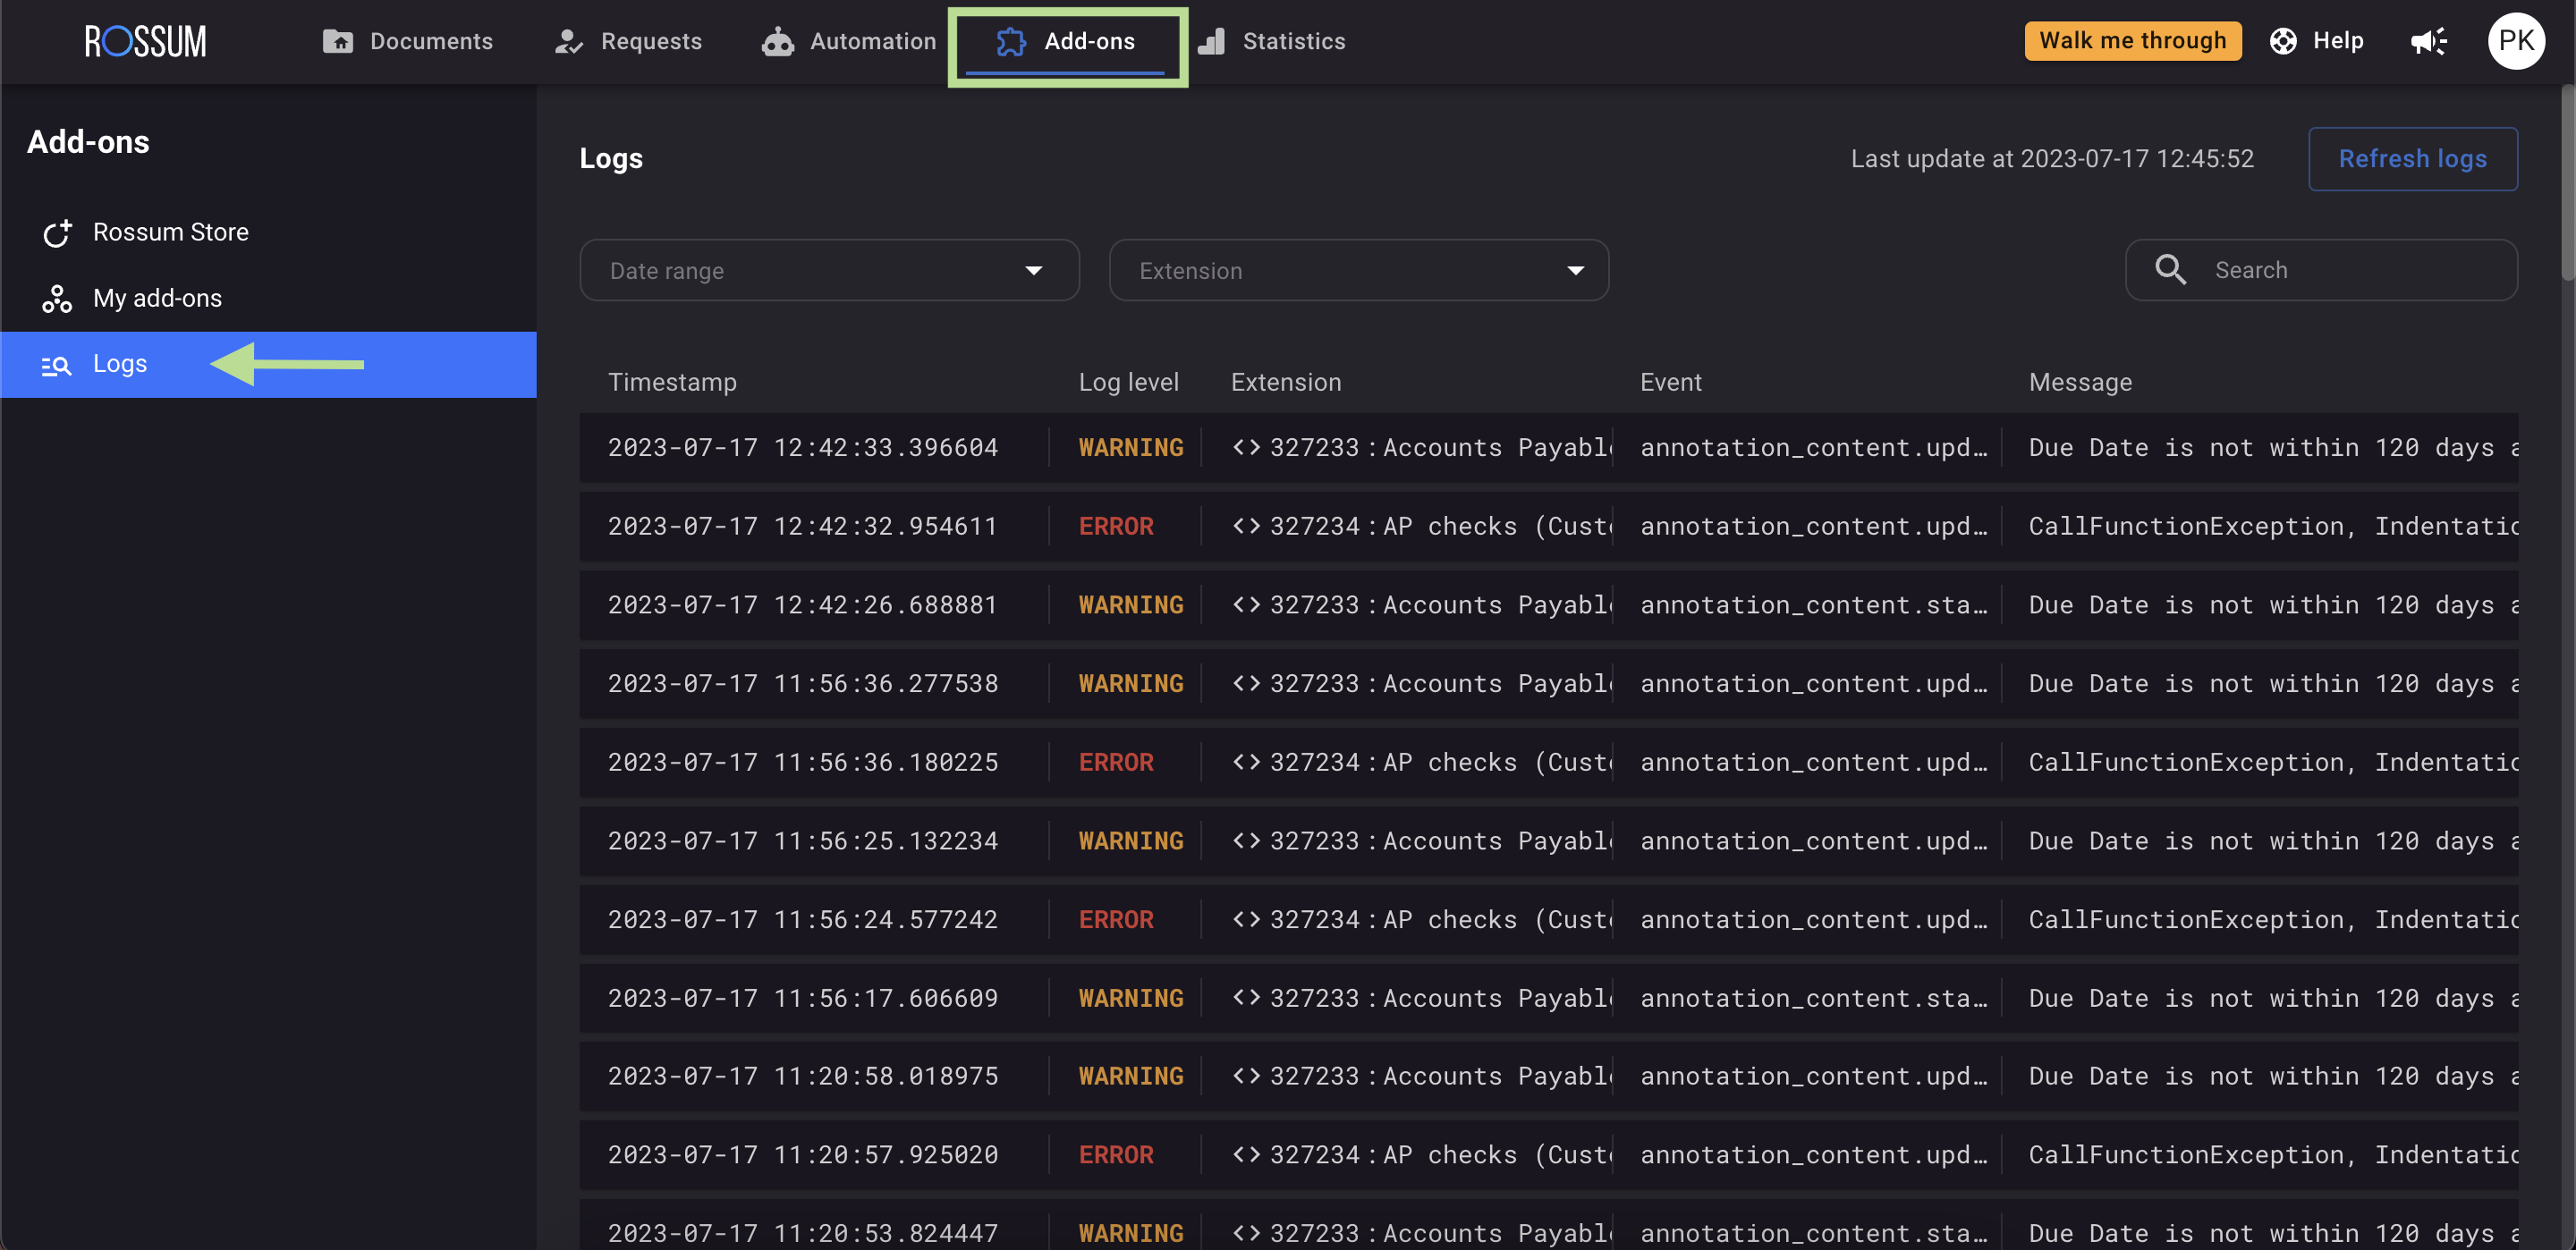
You can filter the logs based on the time of the error and/or a specific extension. There is also a search option available to help you find specific logs.
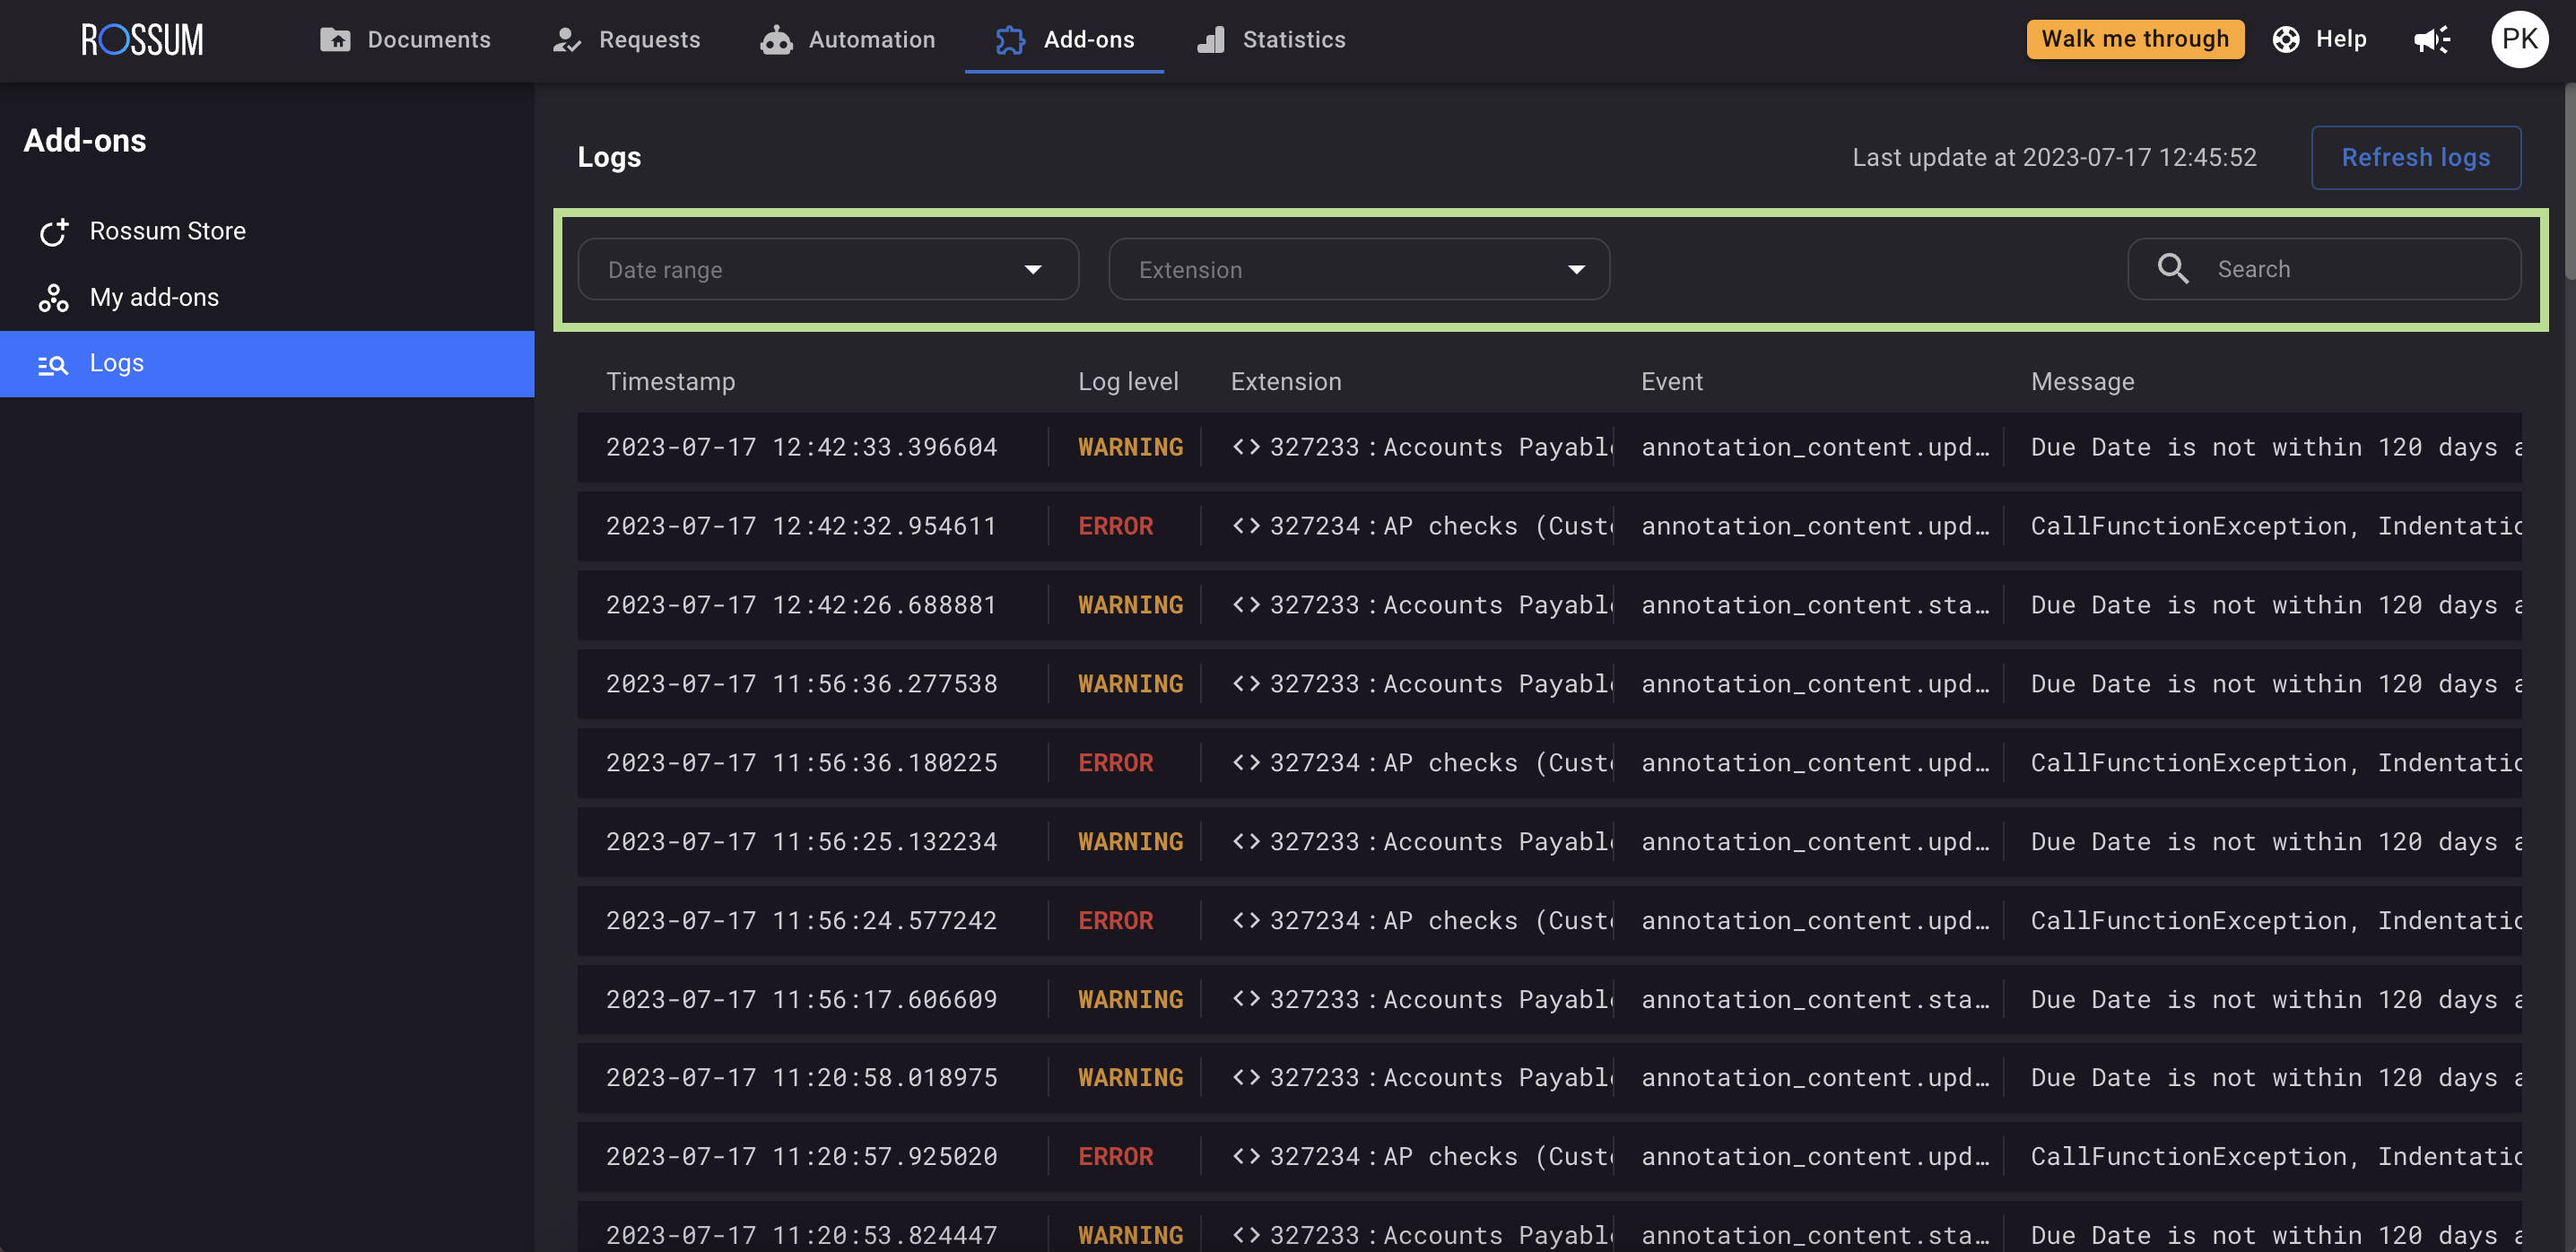
In the top right corner, you will see the last time the logs were updated. You can manually refresh them if needed.
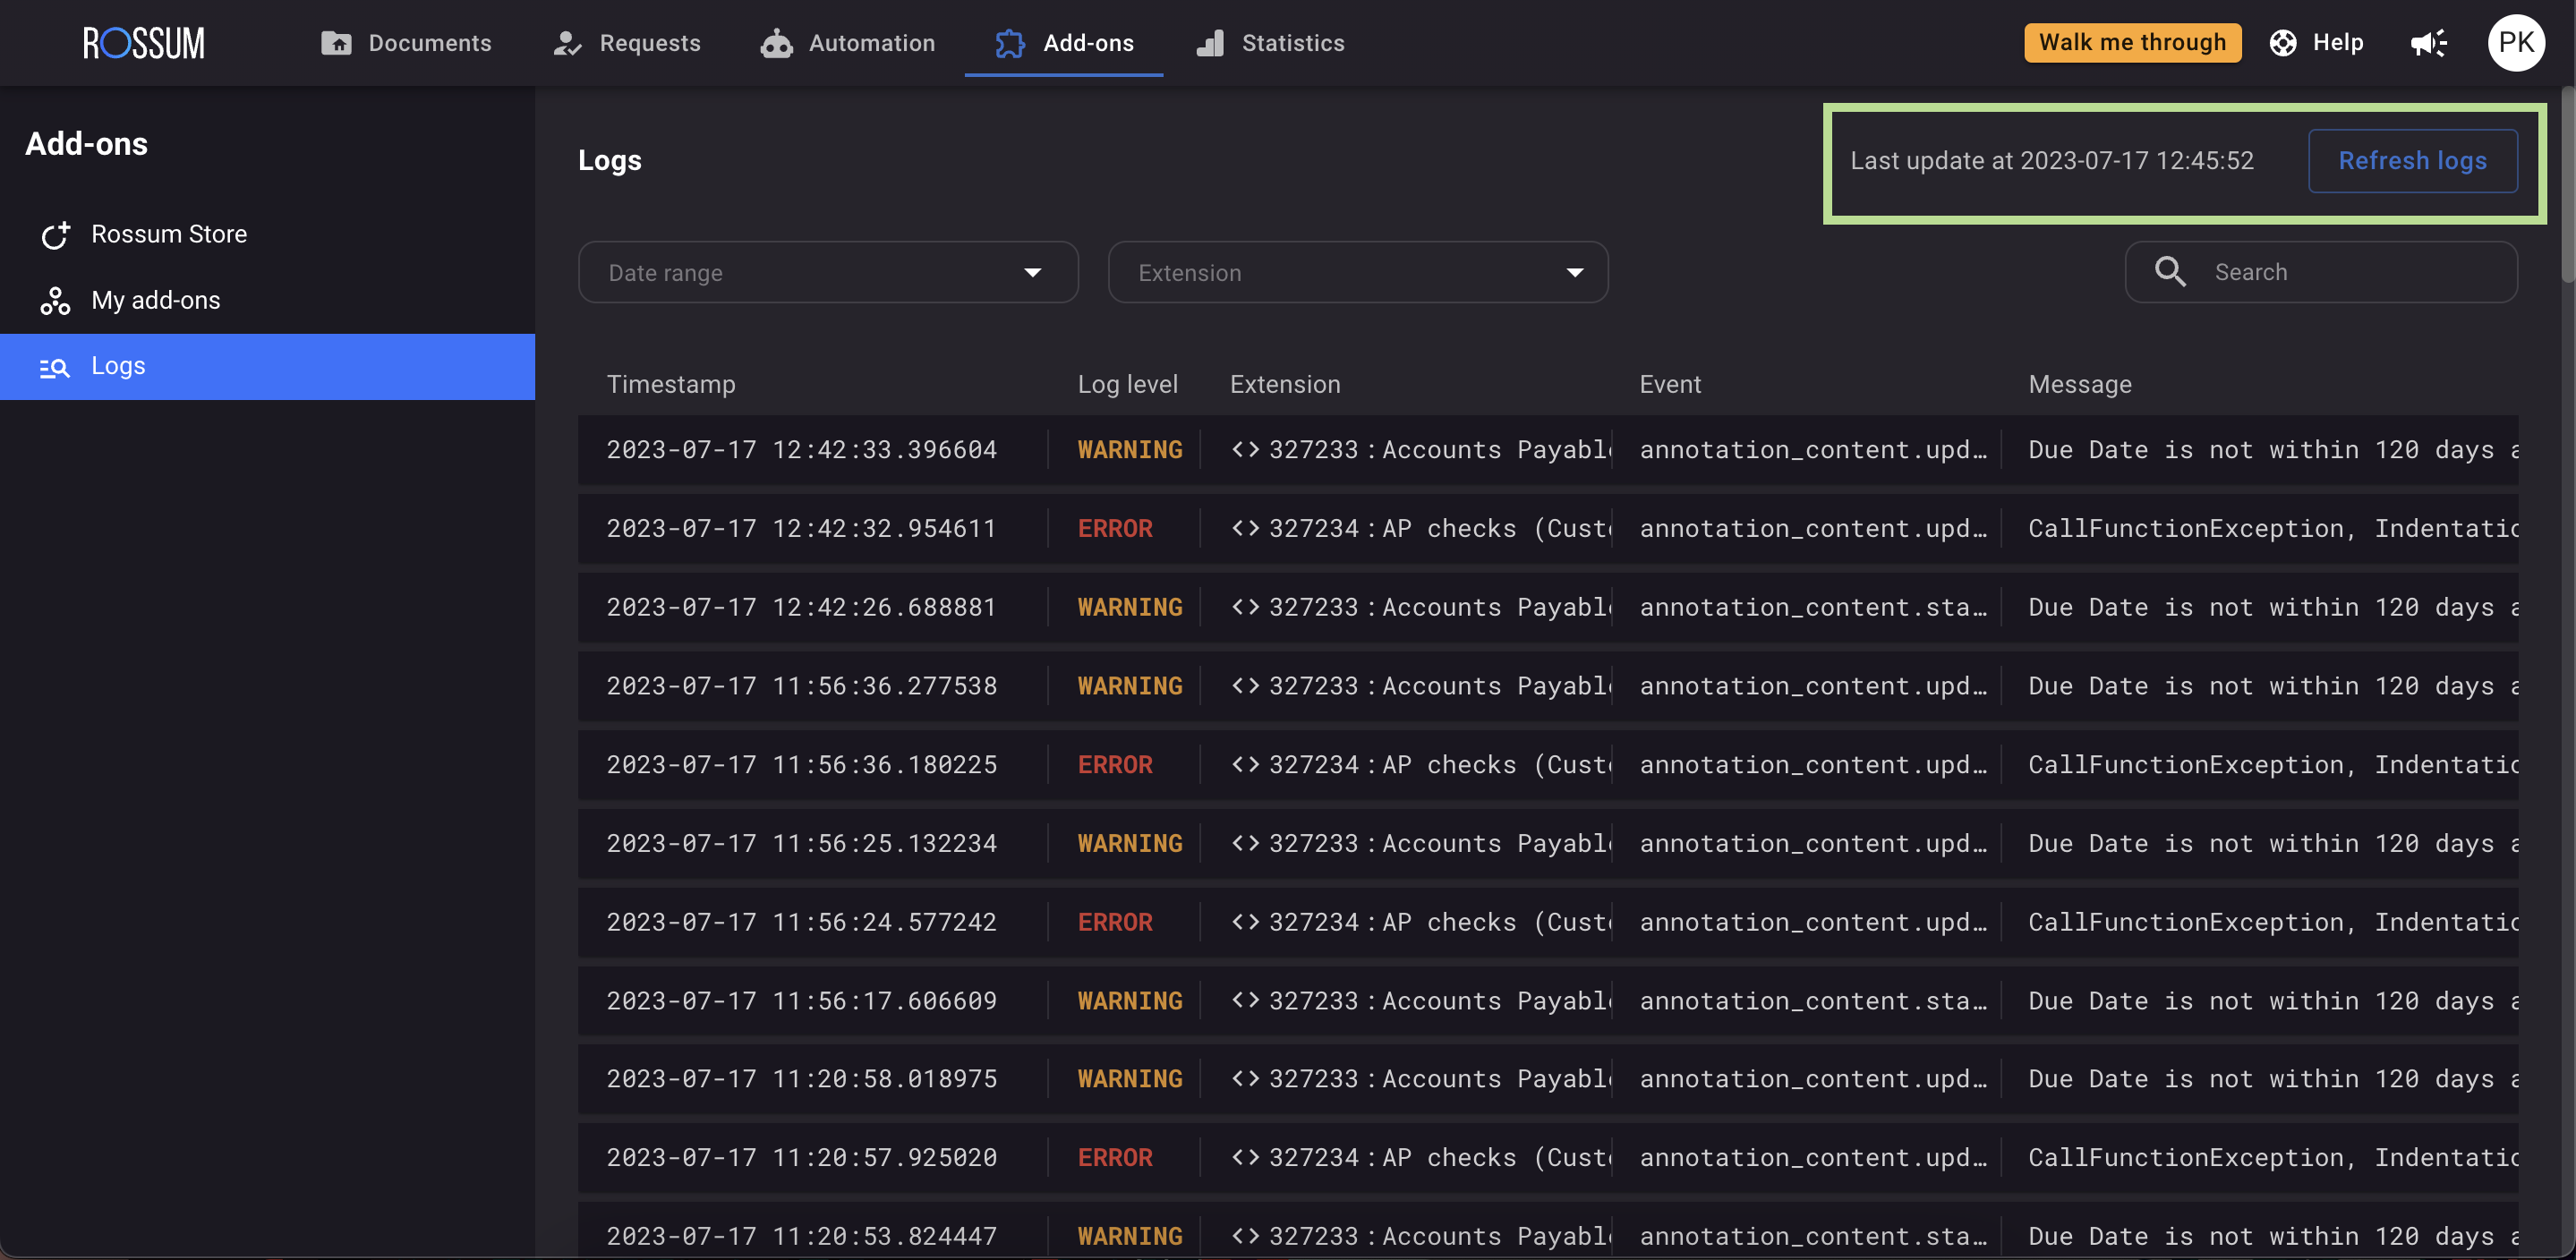
In the main section, you can check the timestamp of each event, the type of message triggered (error, warning, info), the extension responsible for the message, the event that generated the message, and the content of the message.
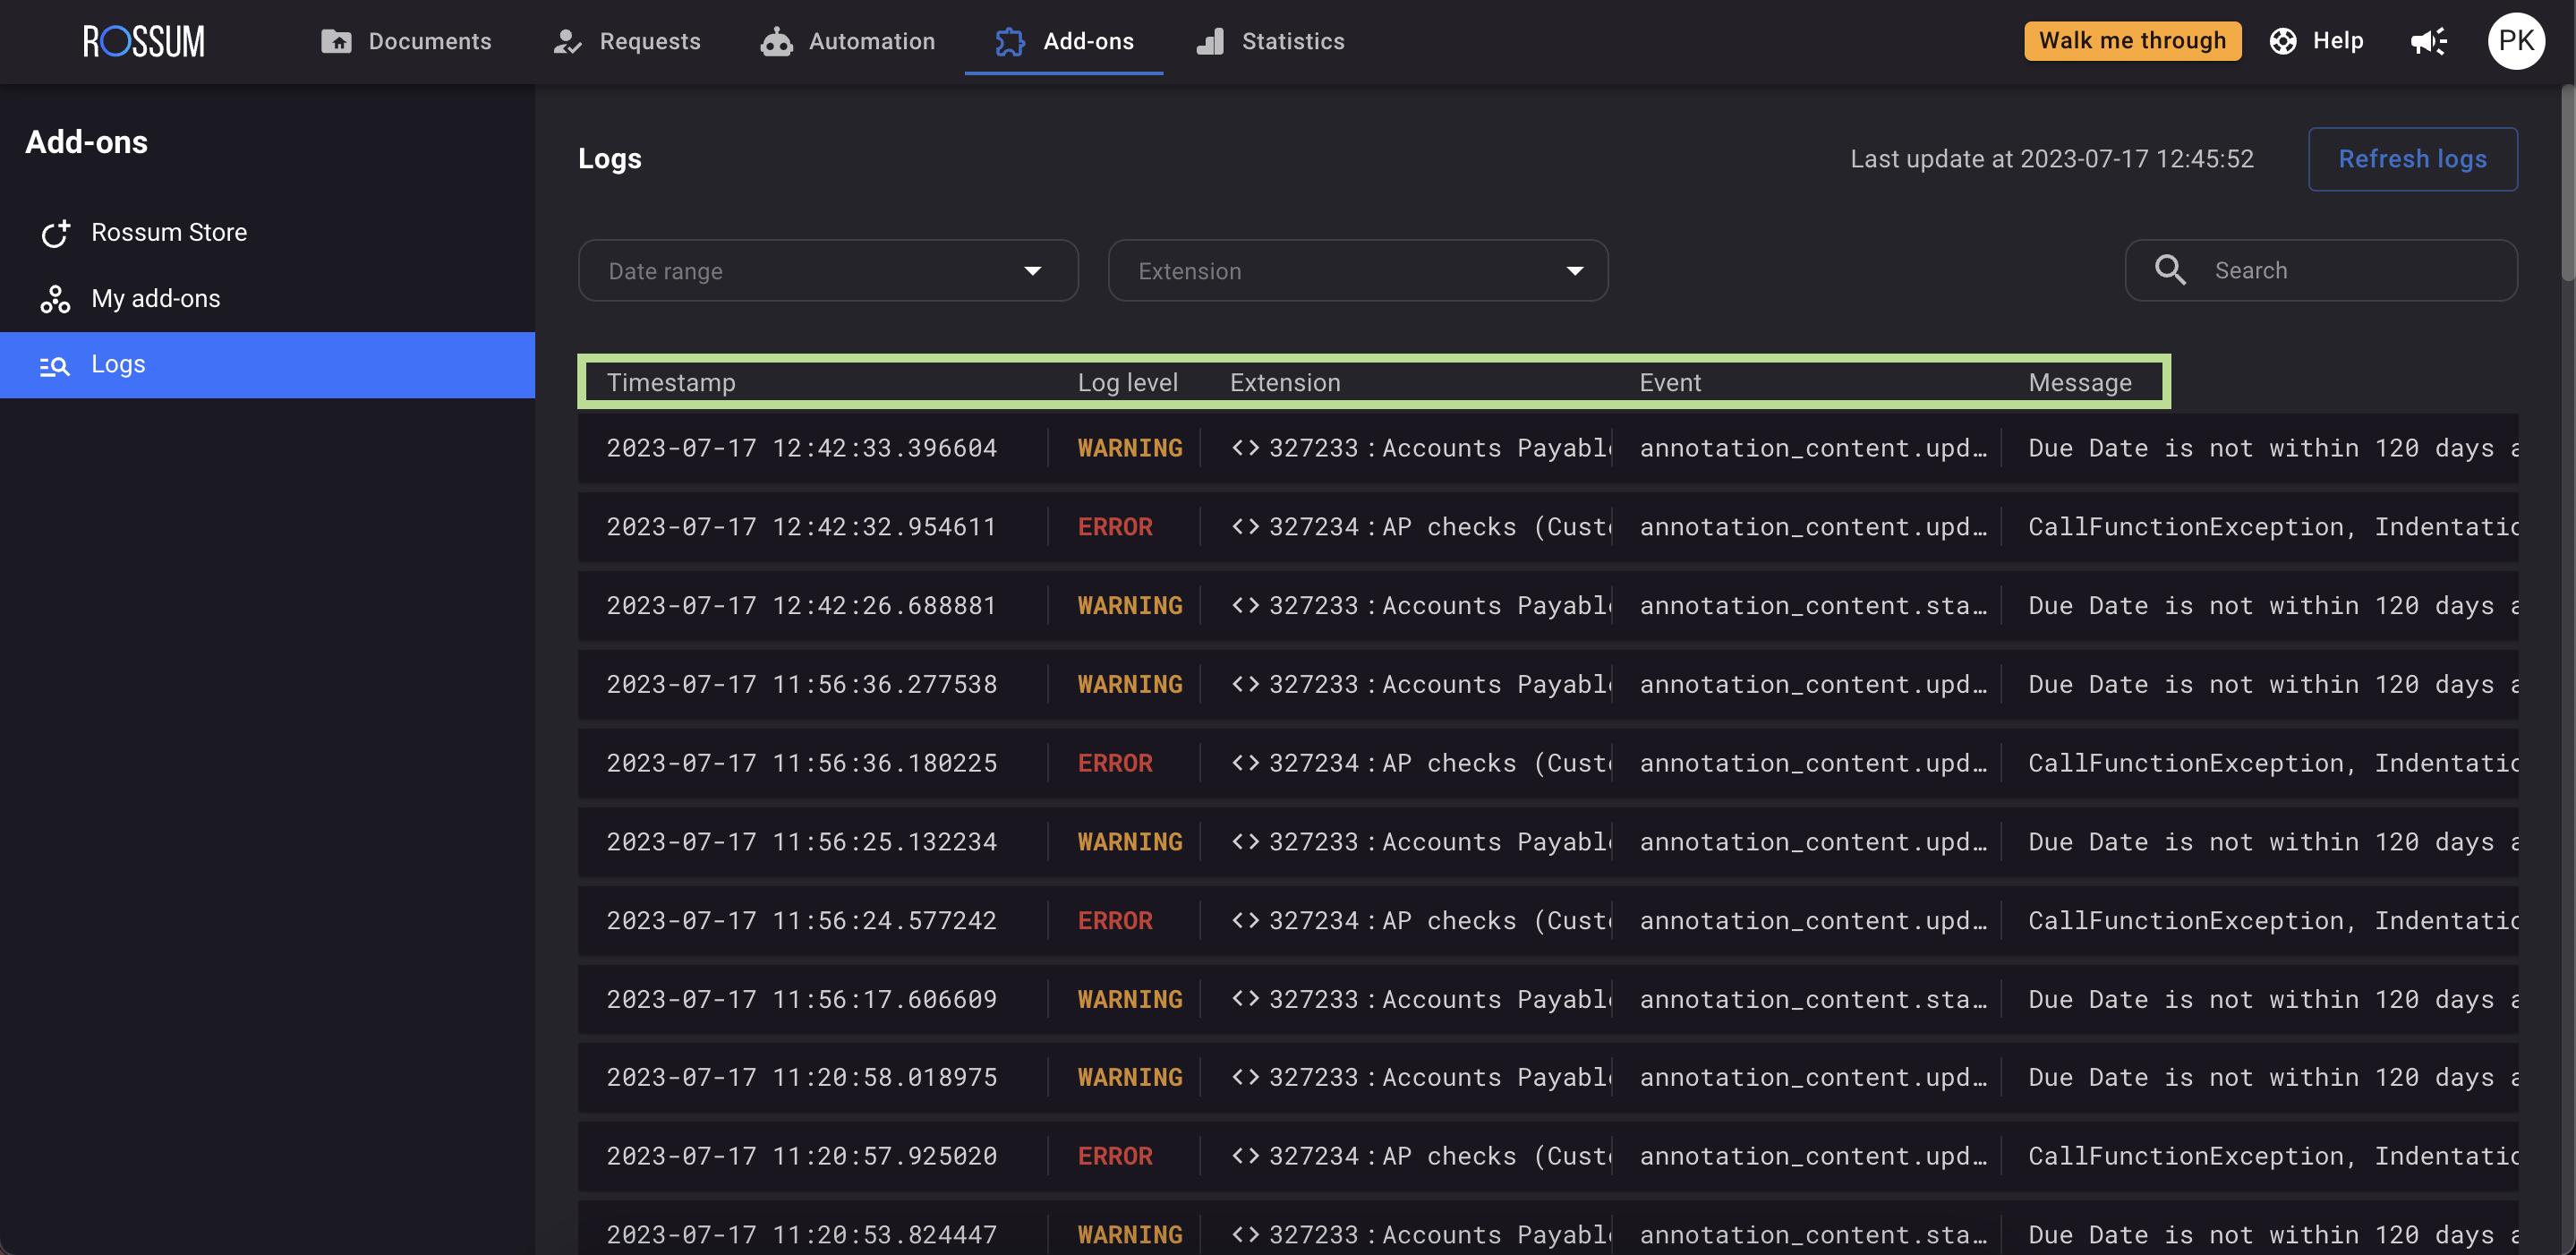
If you want to see more details about a specific record, simply click on it and go to the "Detail" section.

If you wish to log the payload of the extension, including the response and request JSON objects, you need to enable it at the extension level (in the extension settings).
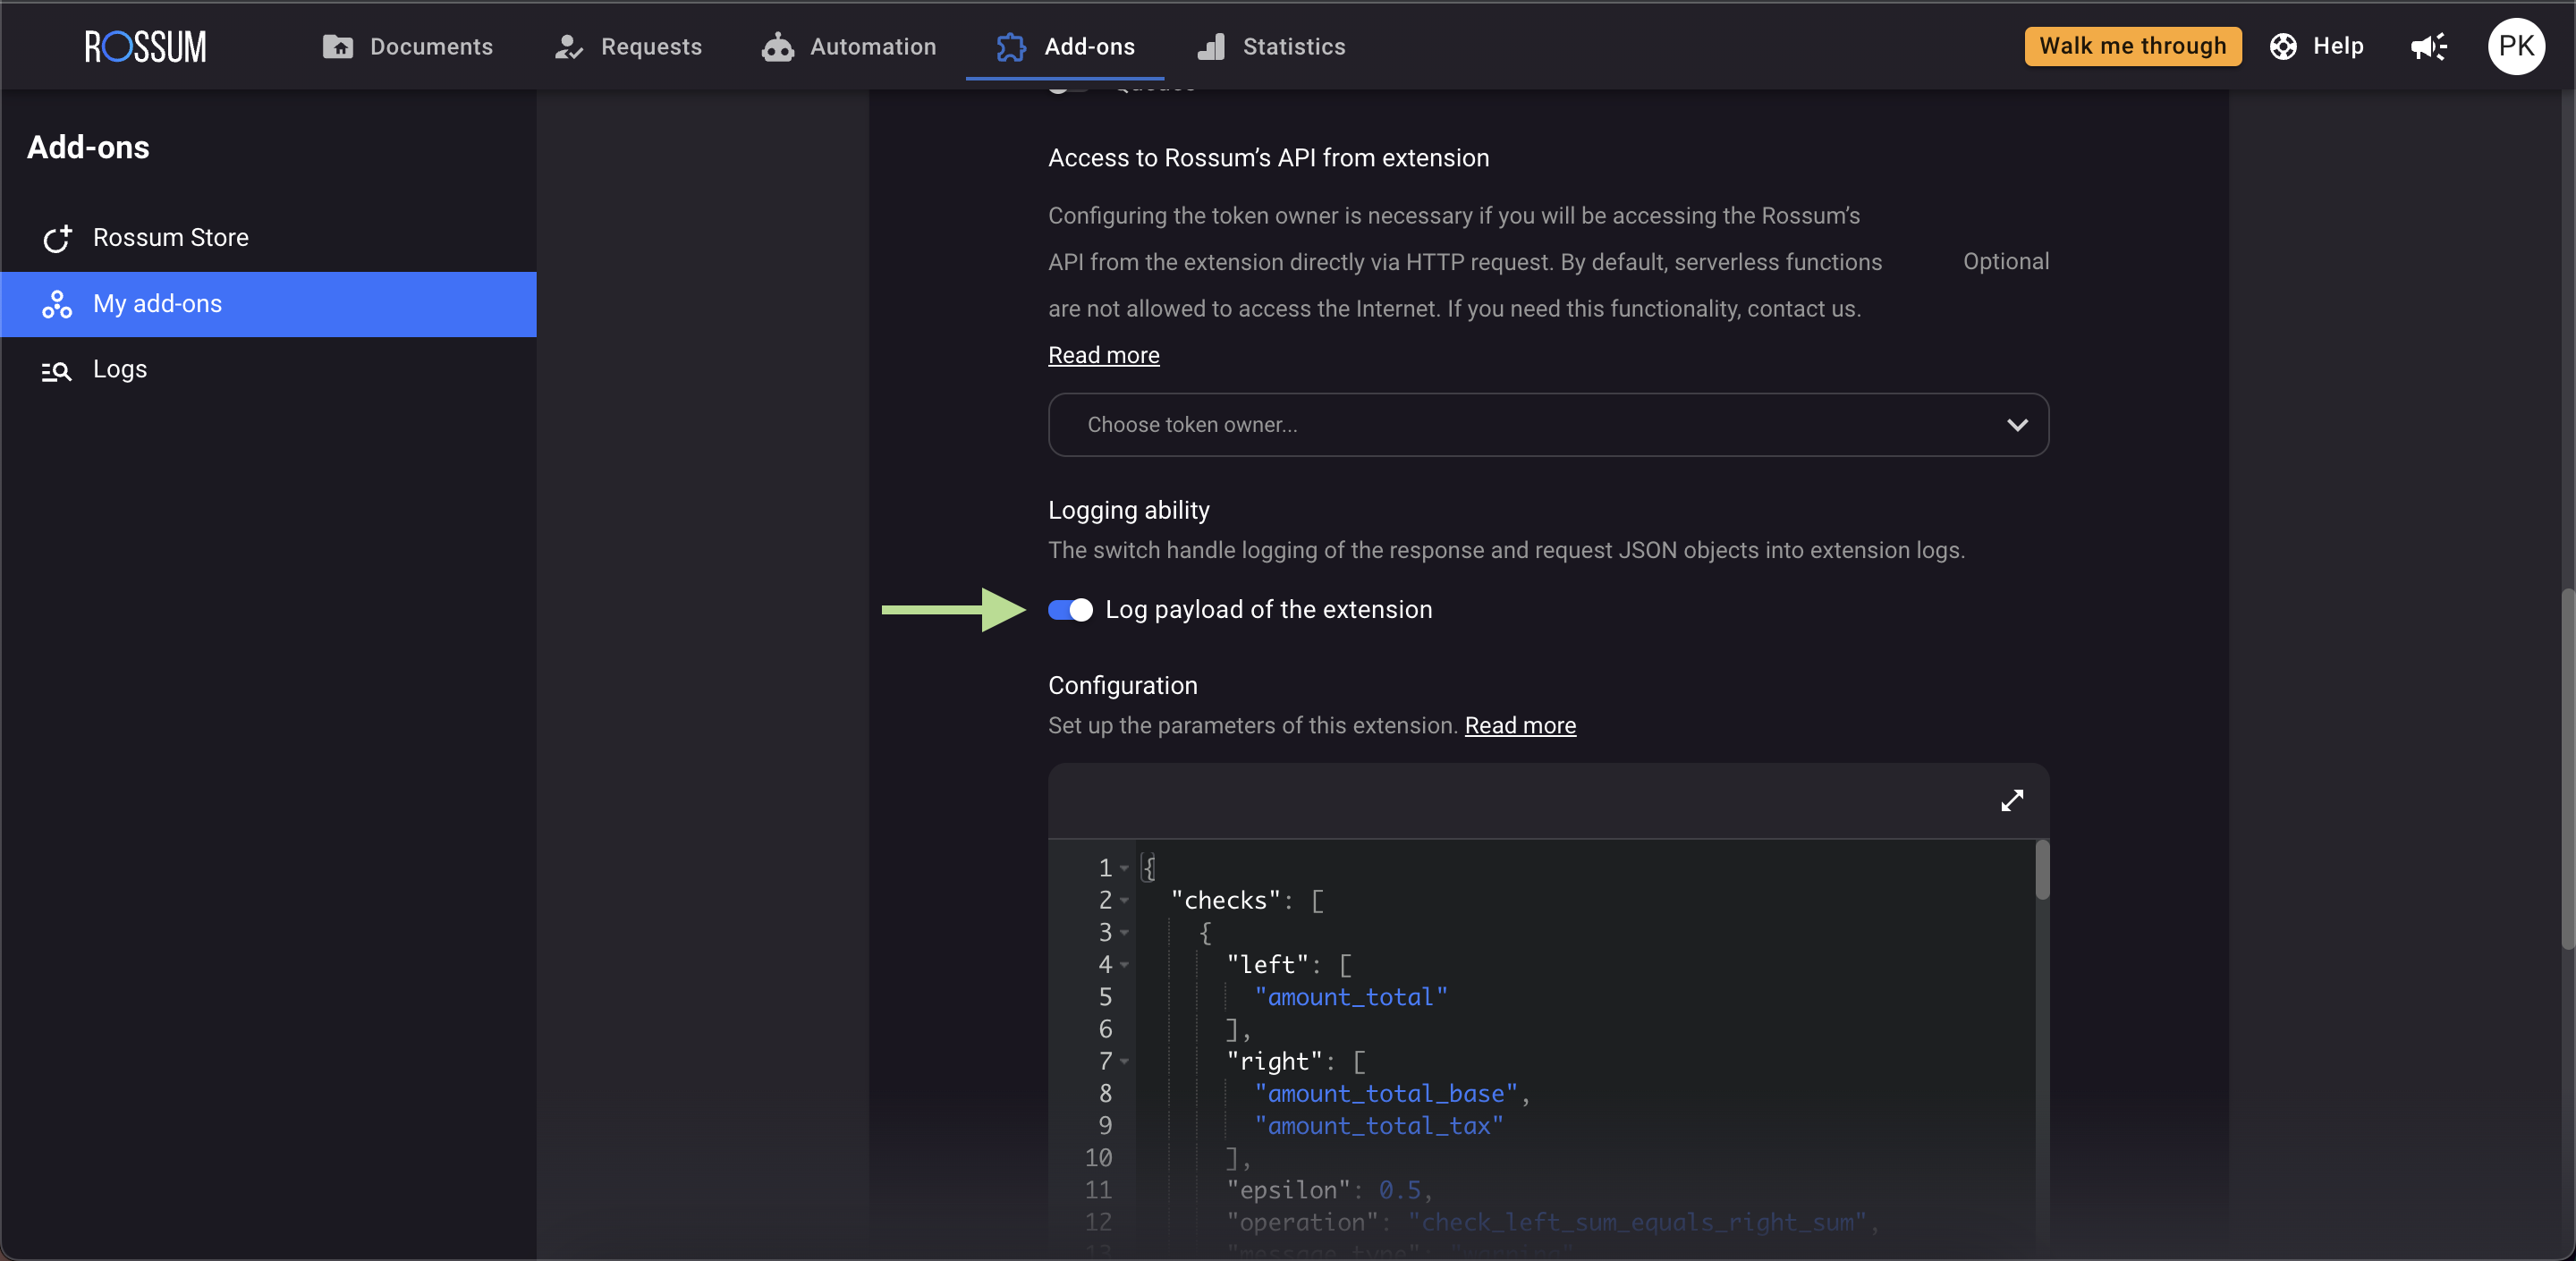
Once enabled, you will have access to even more detailed information in your logs.
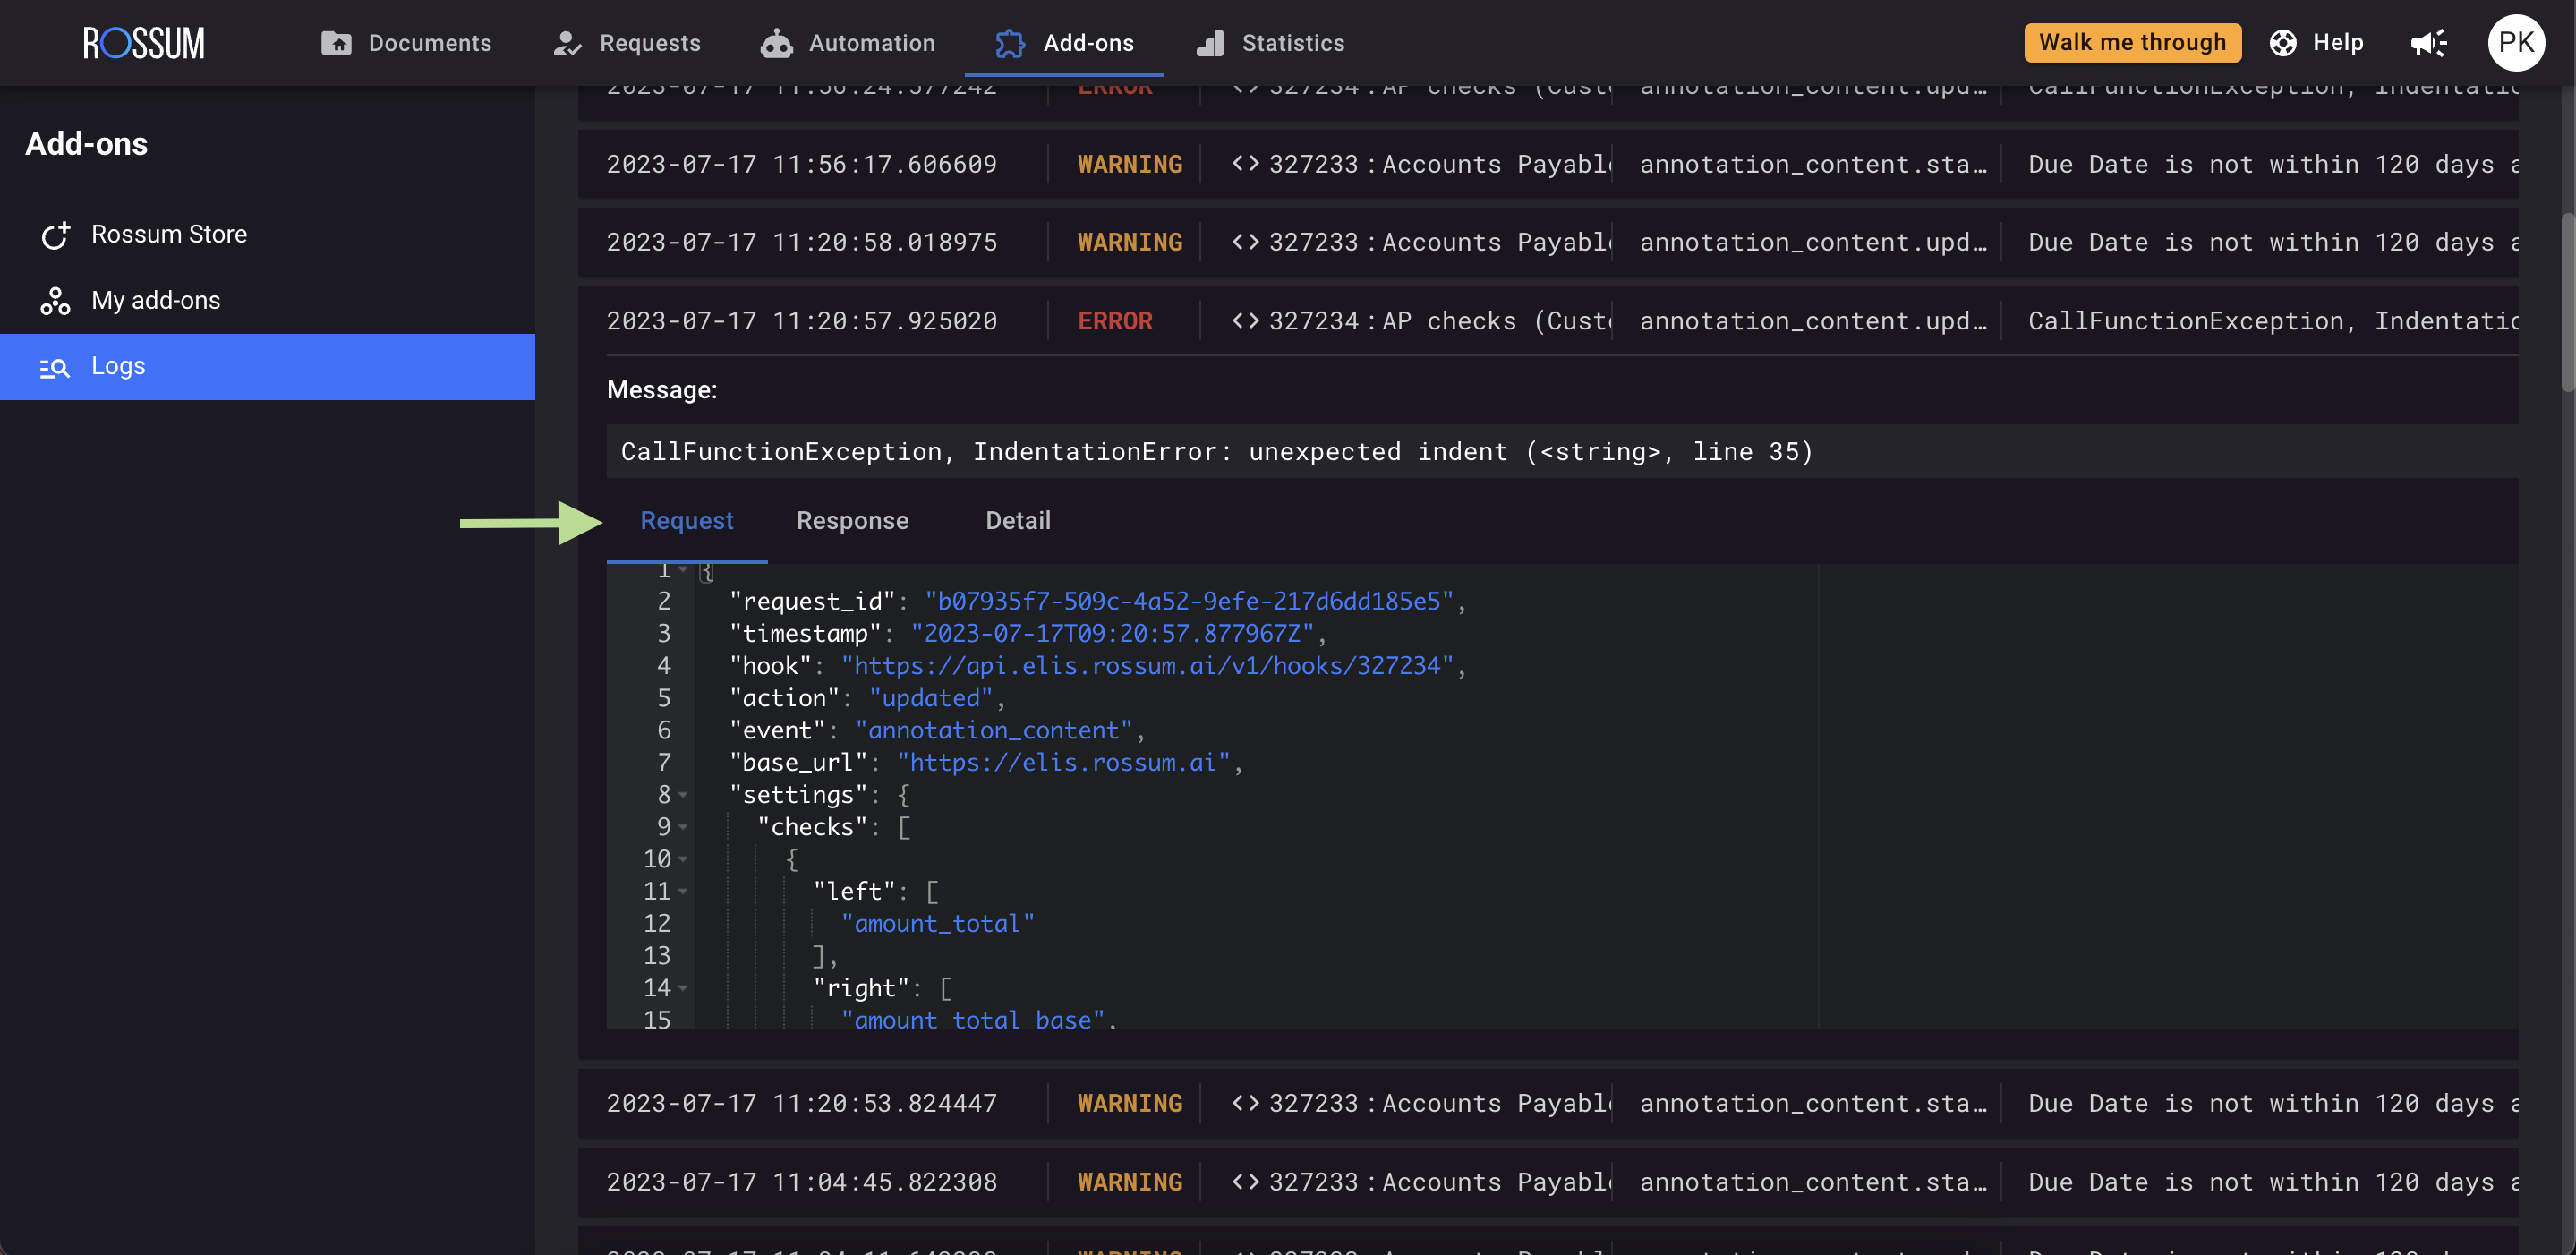
More details can be found in our API documentation - https://elis.rossum.ai/api/docs/#extension-logs
Updated 7 months ago